# hello d3

1
2
3
4
5
6
7
8
9
10
11
12
13
14
15
16
17
18
19
20
21
22
<!DOCTYPE html>
<html lang="en">
<head>
<meta charset="UTF-8" />
<meta name="viewport" content="width=device-width, initial-scale=1.0" />
<meta http-equiv="X-UA-Compatible" content="ie=edge" />
<title>hello</title>
<script src="http://d3js.org/d3.v3.min.js" charset="utf-8"></script>
</head>

<body>
<p>Hello World 1</p>
<p>Hello World 2</p>
</body>
<script>
d3.select('body')
.selectAll('p')
.text('hello d3')
.style('color', 'red')
.style('font-size', '60px')
</script>
</html>

# 选择元素和绑定数据

1
2
3
4
5
6
7
8
9
10
11
12
13
14
15
16
17
18
19
20
21
22
23
24
<body>
<p>Hello World 1</p>
<p>Hello World 2</p>
</body>
<script>
var str = 'D3.JS'
var p = d3.select('body').selectAll('p')
p.datum(str)
p.text(function(d, i) {
return '第 ' + i + ' 个绑定的元素是 ' + d
})

var dataArr = ['吃饭', '睡觉', '打豆豆']
p.data(dataArr)
p.text(function(d, i) {
return d
})
</script>
<!-- <body>
<p>吃饭</p>
<p>睡觉</p>
<p>打豆豆</p>
</body> -->

# 插入

1
2
3
4
5
6
7
8
9
10
11
12
13
14
15
16
17
18
19
20
<body>
<p id="first">Hello World 1</p>
<p>Hello World 2</p>
<p>Hello World 3</p>
</body>
<script>
var body = d3.select('body')
var p1 = body.selectAll('#first')
p1.style('color', 'red')
// body.append('p').text('append');
//为 p1 设置的样式也会应用到 append 的元素, 因为是在 p1 内部
p1.append('p').text('append')
// body.insert('p','#first').text('insert before select element');
</script>

<!-- <body>
<p id="first" style="color: red;">Hello World 1<p>append</p></p>
<p>Hello World 2</p>
<p>Hello World 3</p>
</body> -->

# enter、exit、update

Update、Enter、Exit 是 D3 中用于处理当选择集和数据的数量关系不确定的情况。
如果数组为 [3, 6, 9, 12, 15],将此数组绑定到三个 p 元素的选择集上。可以想象,会有两个数据没有元素与之对应,这时候 D3 会建立两个空的元素与数据对应,这一部分就称为 Enter。而有元素与数据对应的部分称为 Update。如果数组为 [3],则会有两个元素没有数据绑定,那么没有数据绑定的部分被称为 Exit。

update

1
2
3
4
5
6
7
8
9
10
11
12
13
14
15
16
17
18
19
20
21
22
23
24
25
26
27
28
29
30
<body>
<p>Hello World 1</p>
<p>Hello World 2</p>
</body>
<script>
var dataset = [3, 6, 9, 10]

var p = d3.select('body').selectAll('p')

// 获取update部分,dataset num > p num 对应前两个元素
var update = p.data(dataset)

// 获取enter部分,对应后两个元素
var enter = update.enter()

update.text(function(d) {
return 'update' + d
})

// enter 部分处理,添加 p 元素
enter.append('p').text(function(d) {
return 'enter' + d
})
</script>
<!-- <body>
<p>update3</p>
<p>update6</p>
<p>enter9</p>
<p>enter10</p>
</body> -->

exit

1
2
3
4
5
6
7
8
9
10
11
12
13
14
15
16
17
18
19
20
21
22
23
24
25
26
27
28
29
30
31
<body>
<p>Hello World 1</p>
<p>Hello World 2</p>
</body>
<script>
var dataset = [3]

//选择body中的p元素
var p = d3.select('body').selectAll('p')

//获取update部分
var update = p.data(dataset)

//获取exit部分
var exit = update.exit()

//update部分的处理:更新属性值
update.text(function(d) {
return 'update ' + d
})
//exit部分的处理:修改p元素的属性
exit.text(function(d) {
return 'exit'
})
// exit部分的处理通常是删除元素
// exit.remove();
</script>
<!-- <body>
<p>update 3</p>
<p>exit</p>
</body> -->

# 简单图形

1
2
3
4
5
6
7
8
9
10
11
12
13
14
15
16
17
18
19
20
21
22
23
24
25
26
27
28
29
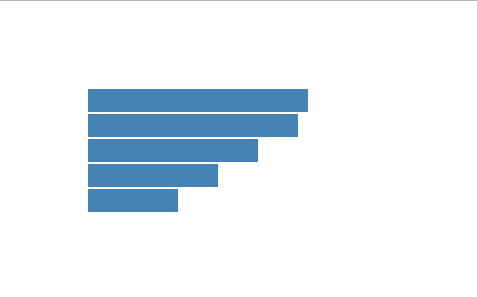
<script>
var width = 300 //画布的宽度
var height = 300 //画布的高度

var svg = d3
.select('body') //选择文档中的body元素
.append('svg') //添加一个svg元素
.attr('width', width) //设定宽度
.attr('height', height) //设定高度

var dataset = [250, 210, 170, 130, 90] //数据(表示矩形的宽度)

var recHeight = 25 //每个矩形所占的宽度包括空白
svg
.selectAll('rect')
.data(dataset)
.enter()
.append('rect')
.attr('x', 80) //每个矩形离浏览器器左端的距离
.attr('y', function(d, i) {
return i * recHeight + 80 //每个矩形离浏览器器左端的距离
})
.attr('width', function(d, i) {
//每个矩形的长度
return d
})
.attr('height', recHeight - 2) //每个矩形的宽度
.attr('fill', 'steelblue')
</script>

# 比例尺

1
2
3
4
5
6
7
8
9
10
11
12
13
14
15
16
17
18
19
20
21
22
<body></body>
<script>
var dataset = [1.2, 2.3, 0.9, 1.5, 3.3]
var min = d3.min(dataset)
var max = d3.max(dataset)

var linear = d3.scale
.linear()
.domain([min, max])
.range([0, 300])
console.log(linear(0.9)) //0
console.log(linear(2.3)) //175

var index = [0, 1, 2, 3, 4]
var color = ['red', 'blue', 'green', 'yellow', 'black']

var ordinal = d3.scale
.ordinal() //ordinal 序数
.domain(index)
.range(color)
console.log(ordinal(1)) //blue
</script>

# 坐标轴

1
2
3
4
5
6
7
8
9
10
11
12
13
14
15
16
17
18
19
20
21
22
23
24
25
26
27
28
29
30
31
32
33
34
35
36
37
38
39
40
41
42
43
44
45
46
<script>
var width = 300 //画布的宽度
var height = 300 //画布的高度

var svg = d3
.select('body') //选择文档中的body元素
.append('svg') //添加一个svg元素
.attr('width', width) //设定宽度
.attr('height', height) //设定高度

var dataset = [2.5, 2.1, 1.7, 1.3, 0.9]

var linear = d3.scale
.linear()
.domain([0, d3.max(dataset)])
.range([0, 250])

var rectHeight = 25 //每个矩形所占的像素高度(包括空白)

svg
.selectAll('rect')
.data(dataset)
.enter()
.append('rect')
.attr('x', 20)
.attr('y', function(d, i) {
return i * rectHeight
})
.attr('width', function(d) {
return linear(d)
})
.attr('height', rectHeight - 2)
.attr('fill', 'steelblue')

var axis = d3.svg
.axis() //D3 中坐标轴的组件,能够在 SVG 中生成组成坐标轴的元素。
.scale(linear) //指定比例尺
.orient('bottom') //指定刻度的方向
.ticks(7) //指定刻度的数量

svg
.append('g')
.attr('class', 'axis')
.attr('transform', 'translate(20,130)') //坐标轴的位置
.call(axis)
</script>

# 动画

1
2
3
4
5
6
7
8
9
10
11
12
13
14
15
16
17
18
19
20
21
22
23
24
25
26
<script>
var width = 500 //画布的宽度
var height = 500 //画布的高度

var svg = d3
.select('body') //选择文档中的body元素
.append('svg') //添加一个svg元素
.attr('width', width) //设定宽度
.attr('height', height) //设定高度

var circle1 = svg
.append('circle')
.attr('cx', 100)
.attr('cy', 100)
.attr('r', 45)
.style('fill', 'green')

//在1秒(1000毫秒)内将圆心坐标由100变为300
circle1
.transition()
.duration(1000)
.ease('circle')
.attr('r', 20)
.attr('cx', 300)
.attr('fill', 'red')
</script>

# 完整柱形图

1
2
3
4
5
6
7
8
9
10
11
12
13
14
15
16
17
18
19
20
21
22
23
24
25
26
27
28
29
30
31
32
33
34
35
36
37
38
39
40
41
42
43
44
45
46
47
48
49
50
51
52
53
54
55
56
57
58
59
60
61
62
63
64
65
66
67
68
69
70
71
72
73
74
75
76
77
78
79
80
81
82
83
84
85
86
87
88
89
90
91
92
93
94
95
96
97
98
99
100
101
102
103
104
105
106
107
108
109
110
111
112
113
114
115
116
117
118
119
120
121
122
123
124
125
126
127
128
129
130
131
132
133
134
135
136
137
138
139
140
141
142
143
144
145
146
147
148
149
150
151
152
153
154
155
156
157
158
159
160
161
<html>
<head>
<meta charset="utf-8" />
<title>交互式操作</title>
</head>

<style>
.axis path,
.axis line {
fill: none;
stroke: black;
shape-rendering: crispEdges;
}

.axis text {
font-family: sans-serif;
font-size: 11px;
}

.MyRect {
}

.MyText {
fill: white;
text-anchor: middle;
}
</style>

<body>
<script src="http://d3js.org/d3.v3.min.js" charset="utf-8"></script>
<script>
//画布大小
var width = 400
var height = 400

//在 body 里添加一个 SVG 画布
var svg = d3
.select('body')
.append('svg')
.attr('width', width)
.attr('height', height)

//画布周边的空白
var padding = {
left: 30,
right: 30,
top: 20,
bottom: 20
}

//定义一个数组
var dataset = [10, 20, 30, 40, 33, 24, 12, 5]

//x轴的比例尺
var xScale = d3.scale
.ordinal()
.domain(d3.range(dataset.length))
.rangeRoundBands([0, width - padding.left - padding.right])

//y轴的比例尺
var yScale = d3.scale
.linear()
.domain([0, d3.max(dataset)])
.range([height - padding.top - padding.bottom, 0])

//定义x轴
var xAxis = d3.svg
.axis()
.scale(xScale)
.orient('bottom')

//定义y轴
var yAxis = d3.svg
.axis()
.scale(yScale)
.orient('left')

//矩形之间的空白
var rectPadding = 4

//添加矩形元素
var rects = svg
.selectAll('.MyRect')
.data(dataset)
.enter()
.append('rect')
.attr('class', 'MyRect')
.attr(
'transform',
'translate(' + padding.left + ',' + padding.top + ')'
)
.attr('x', function(d, i) {
return xScale(i) + rectPadding / 2
})
.attr('y', function(d) {
return yScale(d)
})
.attr('width', xScale.rangeBand() - rectPadding)
.attr('height', function(d) {
return height - padding.top - padding.bottom - yScale(d)
})
.attr('fill', 'steelblue') //填充颜色不要写在CSS里
.on('mouseover', function(d, i) {
d3.select(this).attr('fill', 'yellow')
})
.on('mouseout', function(d, i) {
d3.select(this)
.transition()
.duration(500)
.attr('fill', 'steelblue')
})

//添加文字元素
var texts = svg
.selectAll('.MyText')
.data(dataset)
.enter()
.append('text')
.attr('class', 'MyText')
.attr(
'transform',
'translate(' + padding.left + ',' + padding.top + ')'
)
.attr('x', function(d, i) {
return xScale(i) + rectPadding / 2
})
.attr('y', function(d) {
return yScale(d)
})
.attr('dx', function() {
return (xScale.rangeBand() - rectPadding) / 2
})
.attr('dy', function(d) {
return 20
})
.text(function(d) {
return d
})

//添加x轴
svg
.append('g')
.attr('class', 'axis')
.attr(
'transform',
'translate(' + padding.left + ',' + (height - padding.bottom) + ')'
)
.call(xAxis)

//添加y轴
svg
.append('g')
.attr('class', 'axis')
.attr(
'transform',
'translate(' + padding.left + ',' + padding.top + ')'
)
.call(yAxis)
</script>
</body>
</html>
Edited on